


 19 / 50

KONE 2013 | CORPOR ATE RESPONSIBILIT Y REPORT
ECONOMIC RESPONSIBILIT Y
19
Read more
about our economic performance
www.kone.com/investorsKONE’s financial position was very strong at the
end of December 2013. Cash flow generated
from operations (before financing items and
taxes) was EUR 1,213 (1–12/2012: 1,071) million.
At the end of December 2013, net working capital
was EUR -611.5 (December 31, 2012: -439.3)
million, including financing items and taxes.
Interest-bearing net debt at the end of December
2013 was EUR -622.0 (December 31, 2012:
-574.0) million. KONE’s cash and cash equivalents
together with current deposits were EUR 890.6
(873.2) million at the end of the reporting period.
KONE has a strong balance sheet with a positive
cash position. A strong balance sheet supports
KONE’S growth ambitions. It also enables KONE
to react to attractive opportunities should they
occur within its scope of business. We have no
target for the balance sheet structure and no
dividend or share buy-back policy – the dividend
proposal by the Board of Directors is determined
on the basis of the overall business outlook
and opportunities as well as the current and
anticipated capital structure. For 2013, KONE
distributed in dividends in total EUR 512 million
to its shareholders.
We retain a challenger’s mindset
Between 2005 and 2013, new equipment
has been the fastest growing part of KONE’s
business, and we have improved significantly
our market share in this business. In 2013,
KONE ranked second globally in new
equipment volumes. The share of new
equipment out of total sales has grown in
this period from 40% to 54%, driven by fast
growth in Asia-Pacific. At the same time on
the service side, the share of modernization
has decreased from 19% to 14% and that of
maintenance from 41% to 32%.
Although the fastest growth has been seen in
new equipment, we have also achieved good
growth in the service business since 2005.
In maintenance, our maintenance base has
expanded from 580,000 units at the end of
2005 to over 950,000 units at the end of 2013.
The most significant driver of this growth has
been conversions: obtaining maintenance
contracts for equipment installed by KONE.
In addition, the growth of the maintenance
base has been supported by acquisitions of
small and mid-sized maintenance companies in
Europe and North America. At the end of 2013,
KONE ranked fourth globally measured by the
size of our maintenance base.
Although we have increased our global market
share significantly over the past eight years,
we continue to develop our business with a
challenger’s mindset. Our aim continues to
be to grow faster than the market in all the
different parts of our business.
Long-term financial targets
KONE has reached two of the three long-
term targets communicated in January 2011.
We have grown faster than the market and
improved our working capital rotation. The
third target, which is yet to be reached, is that
of achieving an EBIT margin of 16%. In the
short term, the increase of the share of new
equipment out of KONE’s total sales has been
burdening margin development. However,
with our negative working capital, and high
return on capital in all parts of our business,
we do not seek to optimize the sales mix in the
short term, but to grow absolute EBIT and to
improve profitability in all parts of our business
in the long term. Growth in new equipment
sales contributes to the long-term growth of
the business, and is the best way to secure
future growth in the maintenance business
through obtaining maintenance contracts for
installed equipment.
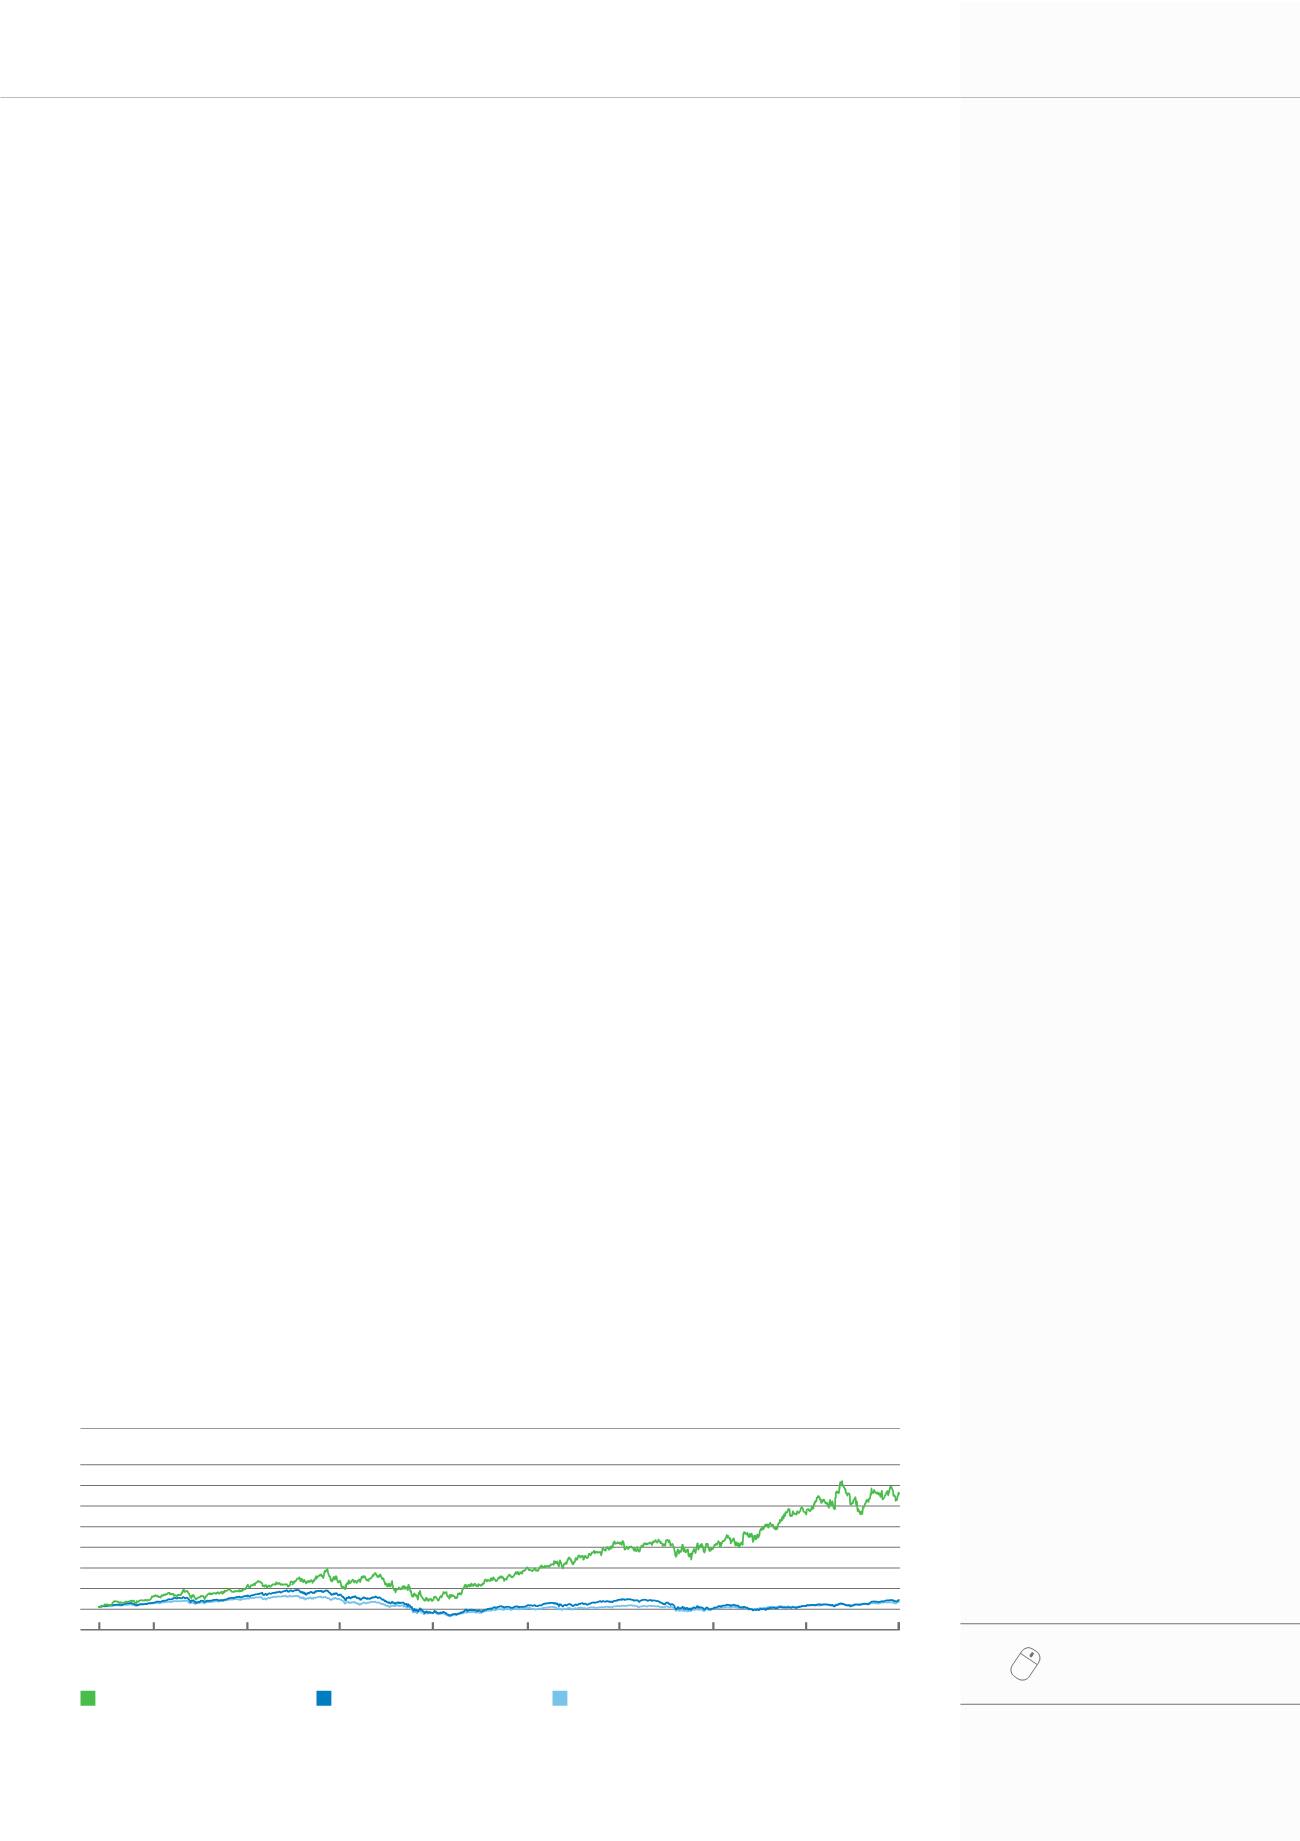
Development of KONE’s share prices versus OMX Helsinki Cap and Euro Stoxx 600
40
35
30
25
20
15
10
5
0
KONE class B share
OMX Helsinki Cap Index
Euro Stoxx 600 Index
Jun 1,
2005
Dec 31,
2013
Jan 1,
2012
Jan 1,
2013
Jan 1,
2011
Jan 1,
2010
Jan 1,
2009
Jan 1,
2007
Jan 1,
2008
Jan 1,
2006