


 26 / 50

KONE 2013 | CORPOR ATE RESPONSIBILIT Y REPORT
ENVIRONMENT
2 6
KONE’s operational environmental work
focuses on reducing our carbon footprint and
improving energy and material efficiency, as
well as reducing water consumption, waste
and the use of hazardous substances. We work
with our suppliers and customers to minimize
the emissions and other adverse environmental
impacts of our business operations and to
prevent them altogether whenever possible. In
order to address the areas that have the most
significant environmental impacts, KONE has
been assessing its carbon footprint since 2008.
In 2013 KONE’s absolute operational carbon
footprint amounted to 305 (2012: 288) ktCO
2
e
(thousand tonnes of carbon dioxide equivalent).
The increase is mainly a result of increased
employee headcount, sales and production
volumes.
In 2013 KONE’s operational carbon footprint
relative to net sales decreased by 3.5%
compared to 2012. The operational carbon
footprint of externally assured scope 1 and
scope 2 greenhouse gas emissions decreased by
9.1% relative to net sales. The absolute scope
1 and 2 carbon footprint decreased by 0.2%,
whereas KONE’s sales volumes increased by
10%.
With 131 (2012: 117) ktCO
2
e in 2013, the
major source of greenhouse gas emissions was
KONE’s logistics operations. The other major
components are our vehicle fleet with 86 (2012:
88) ktCO
2
e, electricity consumption with 45
(2012: 42) ktCO
2
e, fuels for heating and cooling
with 14 (2012: 15) ktCO
2
e, and mobility,
including business air travel and employee
commuting, with 29 (2012: 25) ktCO
2
e.
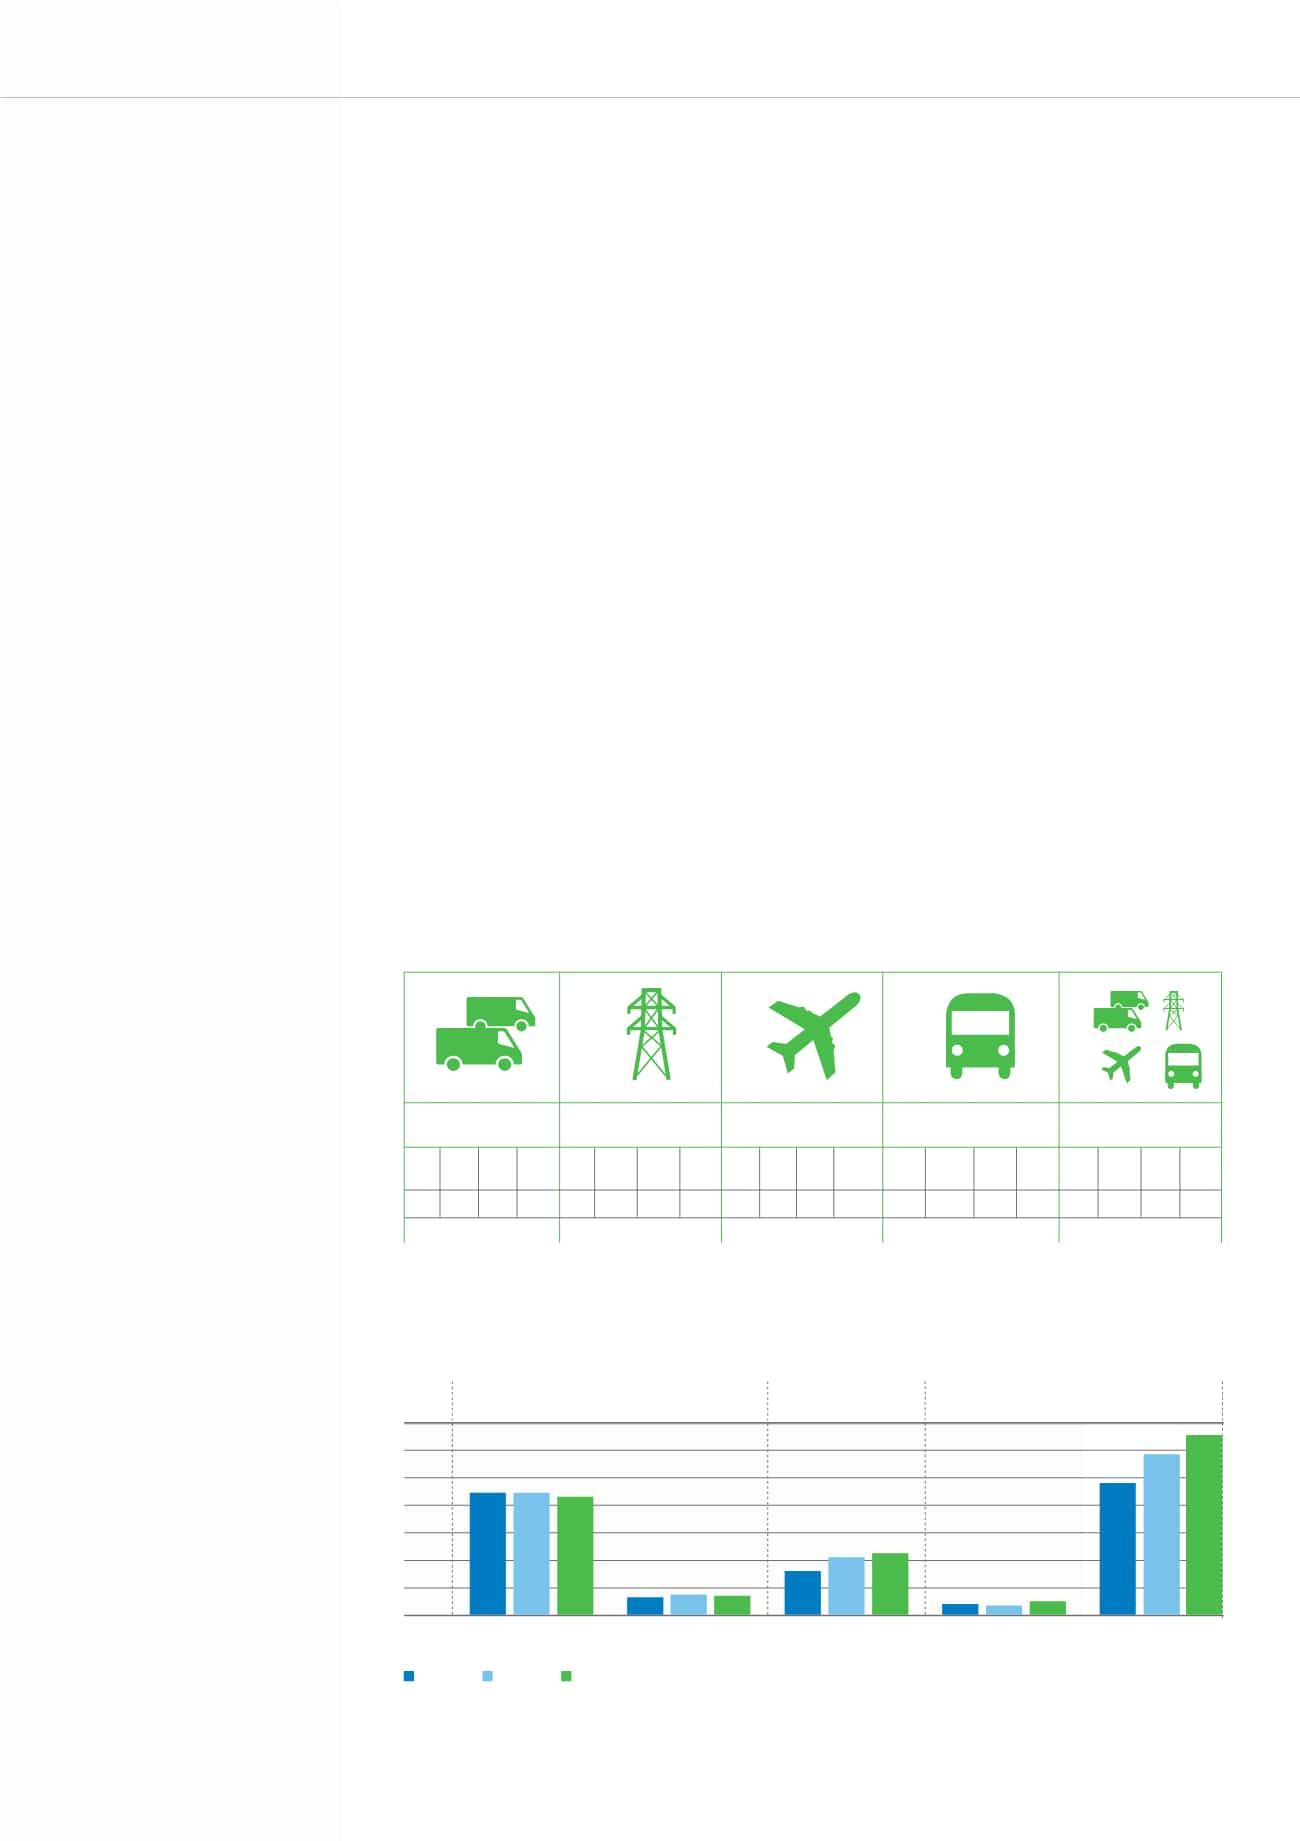
The environmental impact of KONE’s
operations in 2013
Relative operational carbon footprint
* Restated
** Restated to include GiantKONE and India
Data for vehicle fleet, electricity, business air travel and logistics assured externally.
Vehicle fleet
(Scope 1)
Electricity
(Scope 2)
Business air travel
(Scope 3)
Logistics
(Scope 3)
Overall operations
2011 2012 2013 YoY 2011 2012 2013 YoY 2011 2012 2013 YoY 2011 2012 2013 YoY 2011 2012 2013 YoY
85.6 83.1* 77.4 -6.9% 898 1,055 1,027 -2.7% 226 182 226
+24.2%
1,408 1,088** 1,039 -4.5% 47.4 45.8* 44.2 -3.5%
kgCO
2
e / Unit in service kgCO
2
e / Headcount
kgCO
2
e / Headcount
kgCO
2
e / Unit
kgCO
2
e / KEUR Sales
Absolute operational carbon footprint per category, ktCO
2
e
140
120
100
80
60
40
20
0
Vehicle fleet
Scope 1: Direct emissions
Scope 2: Indirect emissions
Scope 3: Other relevant indirect emissions
Heating and cooling
Electricity
Business air travel
Logistics
2011
2012
2013
89 89 86
13 15 14
32
42 45
96
117
131
8 7 10
• 2011 excluding GiantKONE • Logistics 2011 excluding GiantKONE and India • 2013 data for all categories assured externally